

Overview
Resource alerts are automated notifications that monitor your server's performance metrics and notify you when usage patterns may impact server performance. This proactive monitoring helps you identify and resolve issues before they affect your users, including detecting potential security threats such as malware infections, suspicious activity, or unauthorised access attempts.
How Resource Alerts Work
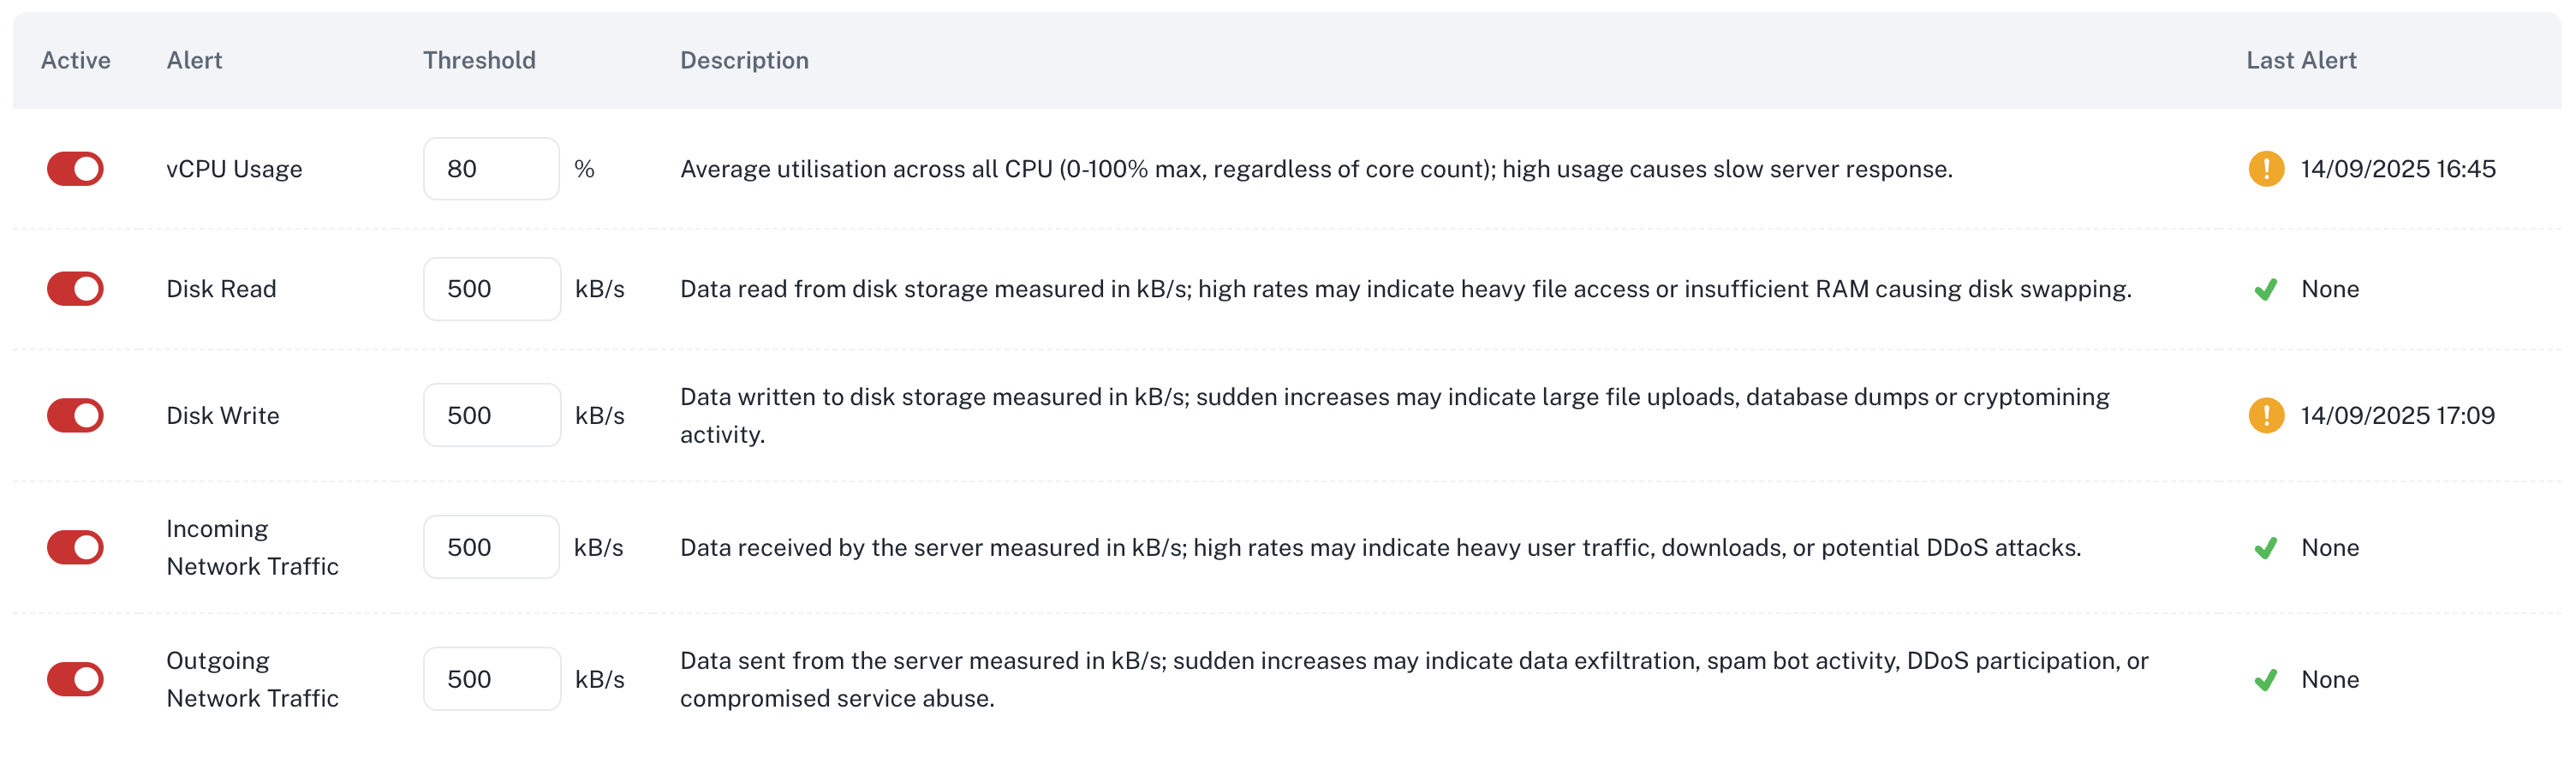
Resource alerts monitor five key metrics:
-
CPU Usage: Average utilisation across all processors (0-100%)
-
Disk Read: Data read from disk storage (kB/s)
-
Disk Write: Data written to disk storage (kB/s)
-
Incoming Network Traffic: Data received by the server (kB/s)
-
Outgoing Network Traffic: Data sent from the server (kB/s)
Monitoring Process:
-
Metrics are collected every 5 minutes
-
Every hour, the system calculates the average of all collected data points
-
If the one hour average exceeds your configured threshold, an alert is sent to your registered email address.
-
To prevent email flooding, subsequent notifications for the same alert are sent at least 4 hours apart.
Understanding Alert Triggers
Sudden increases in resource usage may indicate:
Normal Activities
-
Traffic spikes from marketing campaigns
-
Scheduled backups or maintenance
-
Legitimate user activity increases
-
Software updates or deployments
Potential Issues
-
DDoS attacks or brute force attempts
-
Malware or crypto-mining activity
-
Data exfiltration or unauthorised access
-
Misconfigured applications causing resource loops
Configuring Alert Thresholds
-
Navigate to your server's management page
-
Click on the Resource Monitor tab
-
Select Resource Alerts
-
Adjust thresholds for each metric based on your usage patterns
-
Enable/disable specific alerts as needed
Setting Appropriate Thresholds
-
New servers:
-
Let your server run normally for 24 hours
-
Review the usage graphs for each metric
-
Set thresholds based on the average values observed
-
Add 20-30% buffer for normal variations
-
-
Production servers: Set thresholds 20-30% above typical peak usage
-
Development servers: Consider higher thresholds or disable alerts
Responding to Alerts
When you receive an alert:
-
Do not panic - Alerts are informational and don't require immediate action
-
Check current usage - Log into your server to view real-time metrics
-
Identify the cause:
-
Review recent changes or deployments
-
Check access logs for unusual activity
-
Monitor running processes
-
-
Take action if needed:
-
Scale resources if legitimate growth
-
Block suspicious IPs if under attack
-
Optimise applications if inefficient
-
Adjust alert thresholds if false positive
-
Common Scenarios
High CPU Alert
-
Check for runaway processes:
toporhtop -
Review application logs for errors
-
Consider CPU upgrade if consistently high
High Network Traffic Alert
-
Analyse traffic sources:
netstatoriftop -
Check for DDoS patterns in logs
-
Verify CDN configuration if applicable
High Disk I/O Alert
-
Check for large file operations:
iotop -
Review database query performance
-
Ensure adequate free disk space
Disabling Alerts
To disable alerts:
-
Access the Resource Alerts page
-
Toggle the active switch to off.
Note: We recommend keeping critical alerts active even if you adjust thresholds rather than disabling completely.